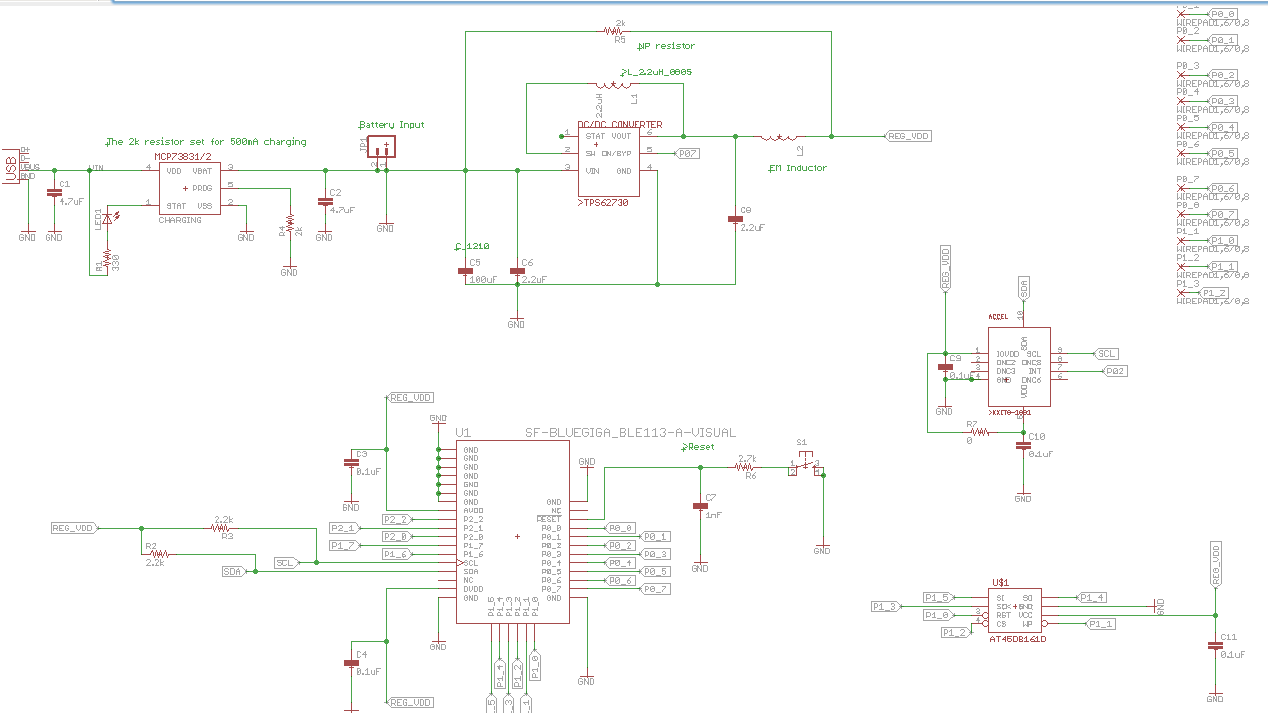
In the past week, we were able to ordered most of the needed hardware, and I was able to use Eagle to start making custom PCB. Eagle has a lot of open source libraries for the hardware we ordered, yet I had to make my own libraries that I could not find online. For example, I made DC/DC buck converter TPS62730, and its footprint size is 1.5mm x 1.05mm, therefore even every little error could be critical. I also made a library for KTIX9 accelerometer that is little bigger the DC buck converter.
However, after talking with TA and Professor Patel, we decided not to use buck converter for two reason, the first one is it is not necessary to DC buck converter to make the system power efficient since the system will be operating with 3.3 V; the second reason the DC buck converter package is QFN, which in not human solderable. It is better off not to use. In conclusion, we will need finalize the both schematic and layout the PCB, and then launch 1x1 scale PCB on printing paper, and check if the parts we order fit into spots.
 I did a first draft paper prototype of what our phone application UI might look like. This will no doubt change a lot as we communicate with Dori Rosenberg from Group Health about what they would like the data visualization to look like.
I didn't draw the interface for pairing the phone and the device yet. The part I'm most unsure of is the calendar display; It might be better to display the summary information on the calendar visually, rather than using numeric times.
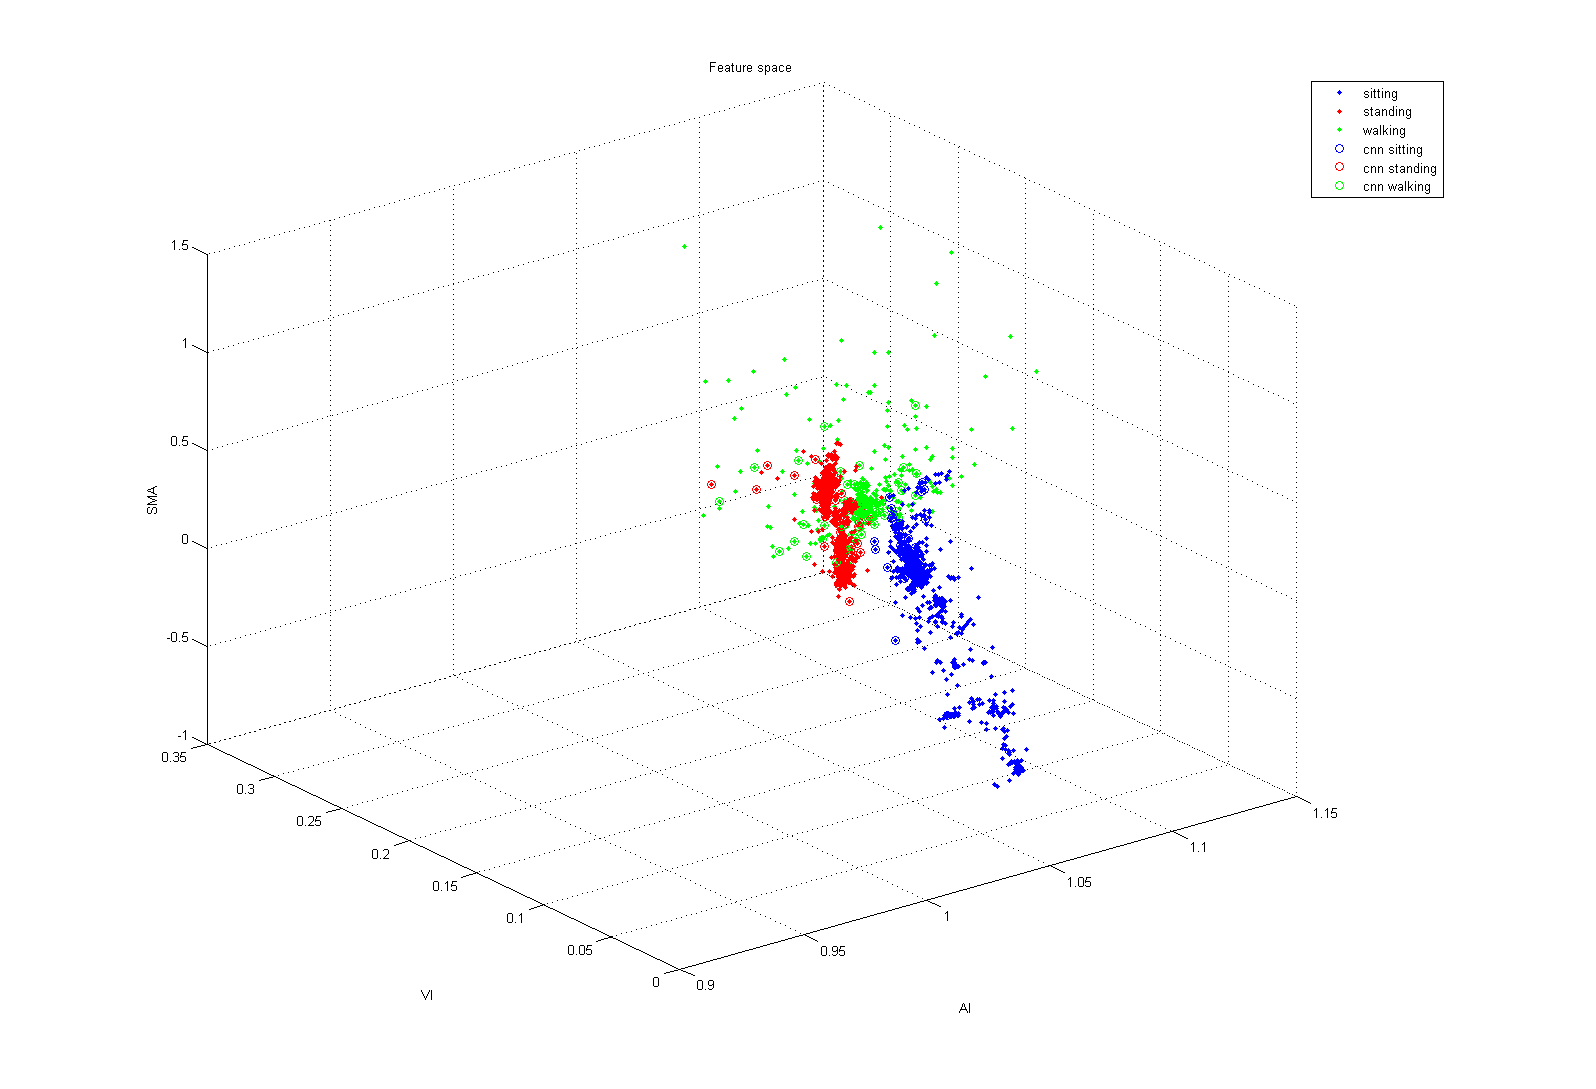
I collected accelerometer data from Peter, Zachary and myself, and applied some machine learning algorithm. I extracted three features out of the 10 Hz 3-axis accelerometer data. Those features are Average Motion Intensity (AI), Variance of Motion Intensity(VI), and Normalized Signal Magnitude Area (SMA). The diagram below show all the feature extracted from the data set, the data denote with CNN are used for CNN algorithm, which the data are condensed for that algorithm. We can get 97% test set accuracy by using CNN algorithm, and 91% by using logistic regression classifier. However, CNN algorithm is easy to affected by noise. We could remove the noise before we applied CNN, so that we get a higher accuracy. Since we already have the multiple machine learning algorithm ready, I will start working on the iOS app that interface with our device.
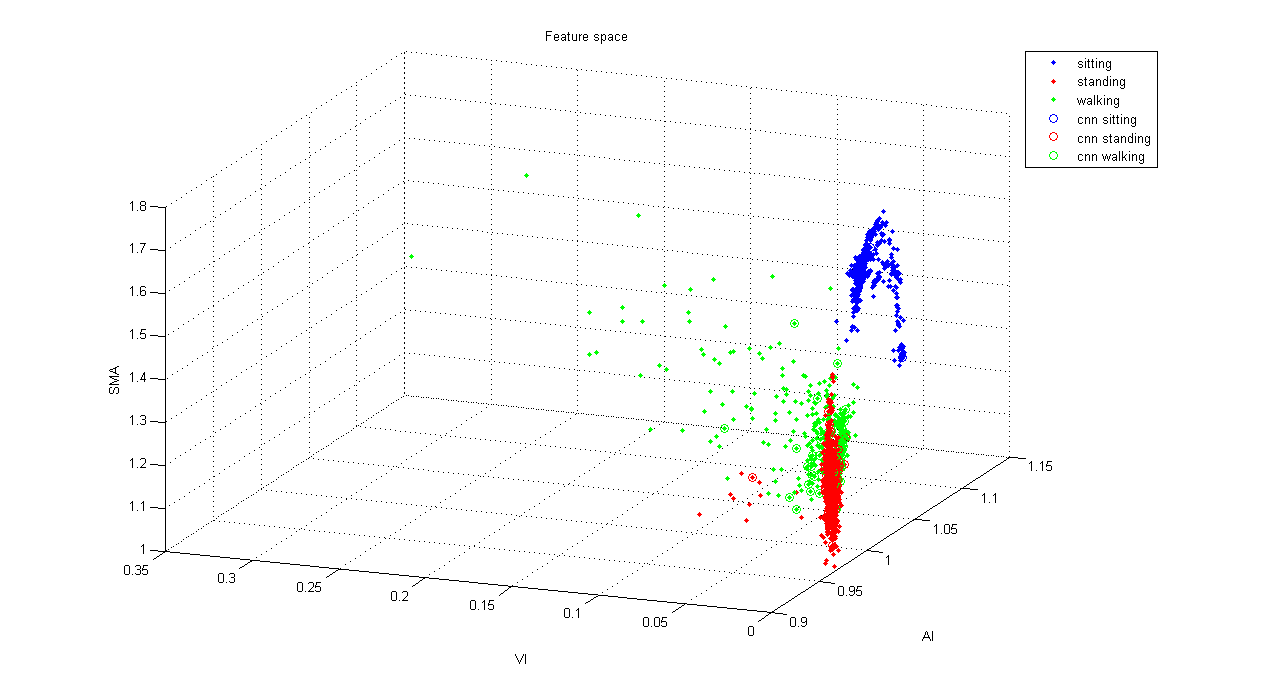
Edit:
I just found out I forgot to take absolute the values on the SMA calculation. However, the accuracy did not change. Below is the corrected diagram.
 We acquired a TI SensorTag to use as a prototype for our posture sensor. Steven spent some time in Matlab doing data mining to figure out how to recognize sitting, standing, lying down, and walking from sample data we took with our first prototype.
This week we will be modifying the SensorTag firmware to attempt to recognize posture using accelerometer data on the SensorTag itself. Soon we'll start working on developing an iOS application to receive posture logs from the chip over bluetooth.
This week we'll also be starting to design a circuitboard for our product. We hope to send off the design to be fabricated early next week, so we can get the board back the week after, then solder on the components, design and print a case, and test our application on the actual board.
We collected some data from a Megamini R4 board taped to the upper leg, to see how difficult it will be to detect sitting and standing.
Our test setup.

The Matlab output of our data. We collected the data using Teraterm from the serial output of the arduino, and formatted and graphed it using Matlab. We started with sitting, and transitioned to standing and back to sitting again. The transitions can be clearly seen, particularly in the first and third graphs (X and Z accel). The next step is to determine how difficult it will be to detect these transitions and not other activity.