I made an iPhone app that takes data from our 2nd prototype, and applied the same algorithm. We get similar graph and accuracy as the first prototype. I will start working on the iPhoene app that incorporates the Zach's UI design this week.
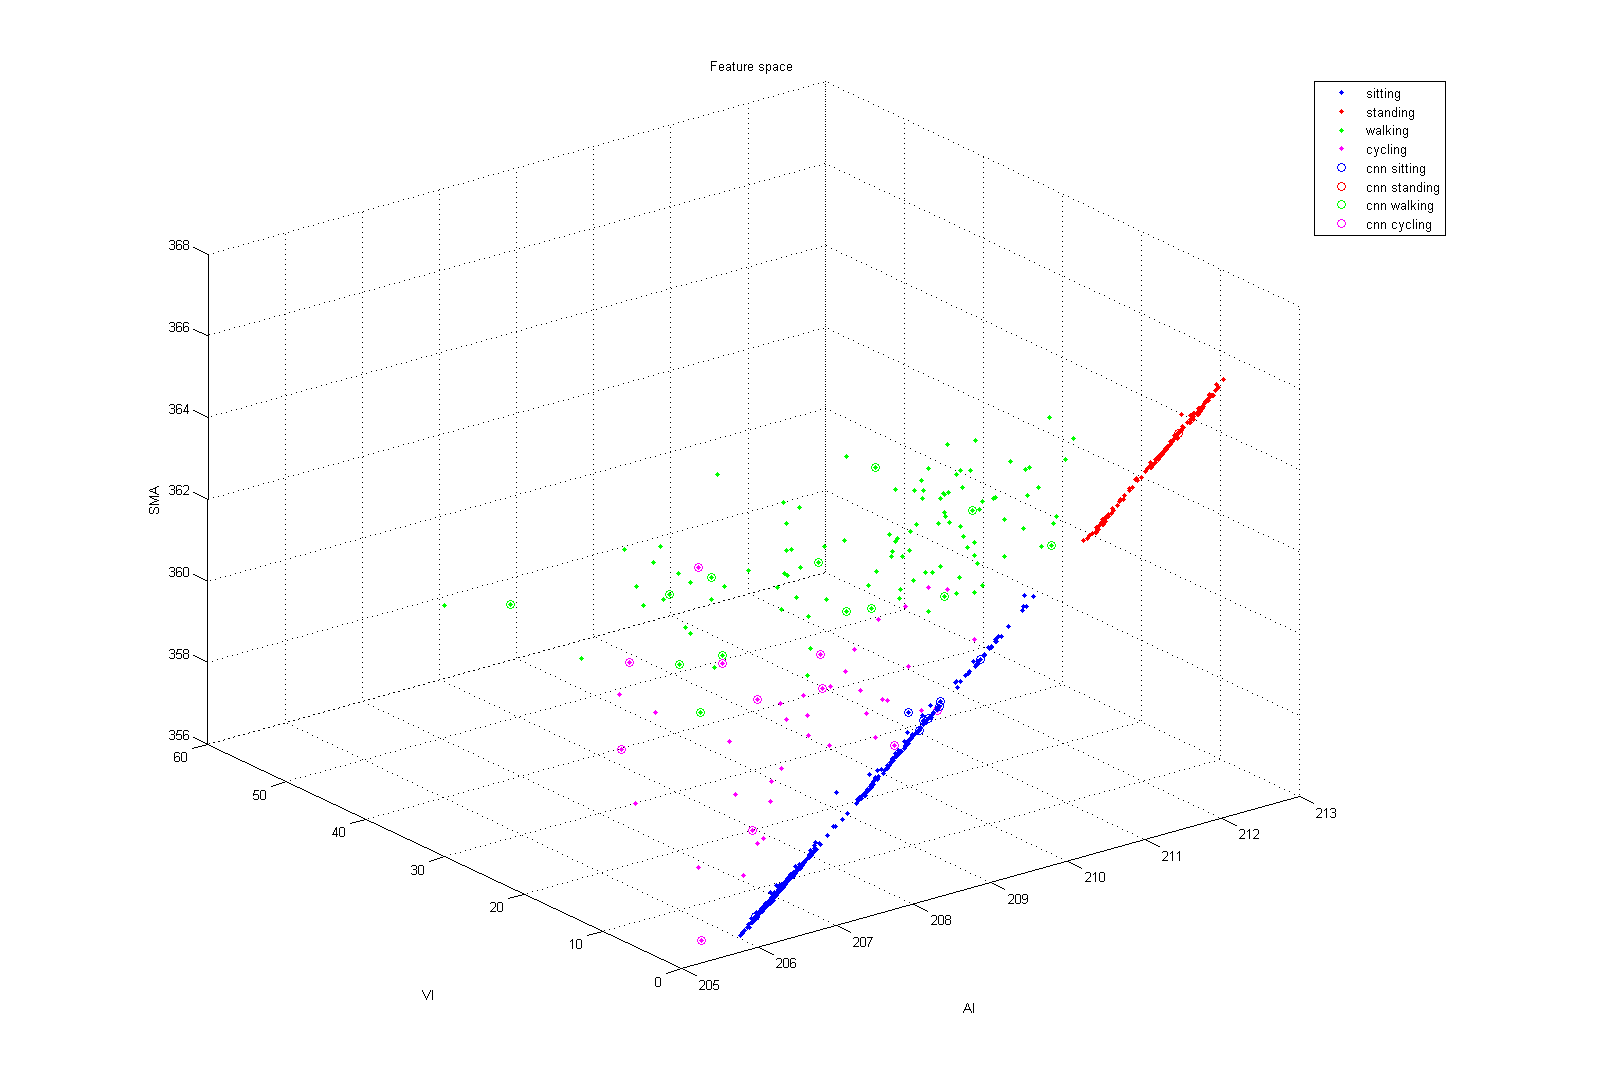
Edit: add the cycling data
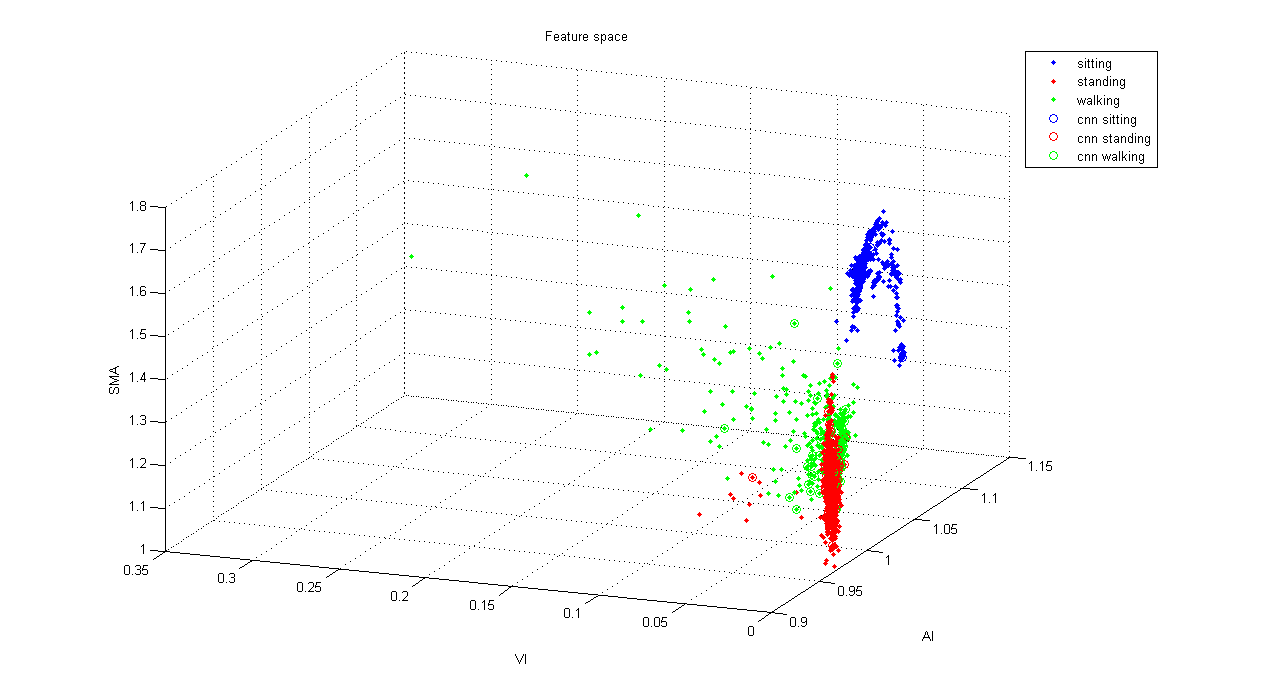
 I collected accelerometer data from Peter, Zachary and myself, and applied some machine learning algorithm. I extracted three features out of the 10 Hz 3-axis accelerometer data. Those features are Average Motion Intensity (AI), Variance of Motion Intensity(VI), and Normalized Signal Magnitude Area (SMA). The diagram below show all the feature extracted from the data set, the data denote with CNN are used for CNN algorithm, which the data are condensed for that algorithm. We can get 97% test set accuracy by using CNN algorithm, and 91% by using logistic regression classifier. However, CNN algorithm is easy to affected by noise. We could remove the noise before we applied CNN, so that we get a higher accuracy. Since we already have the multiple machine learning algorithm ready, I will start working on the iOS app that interface with our device.
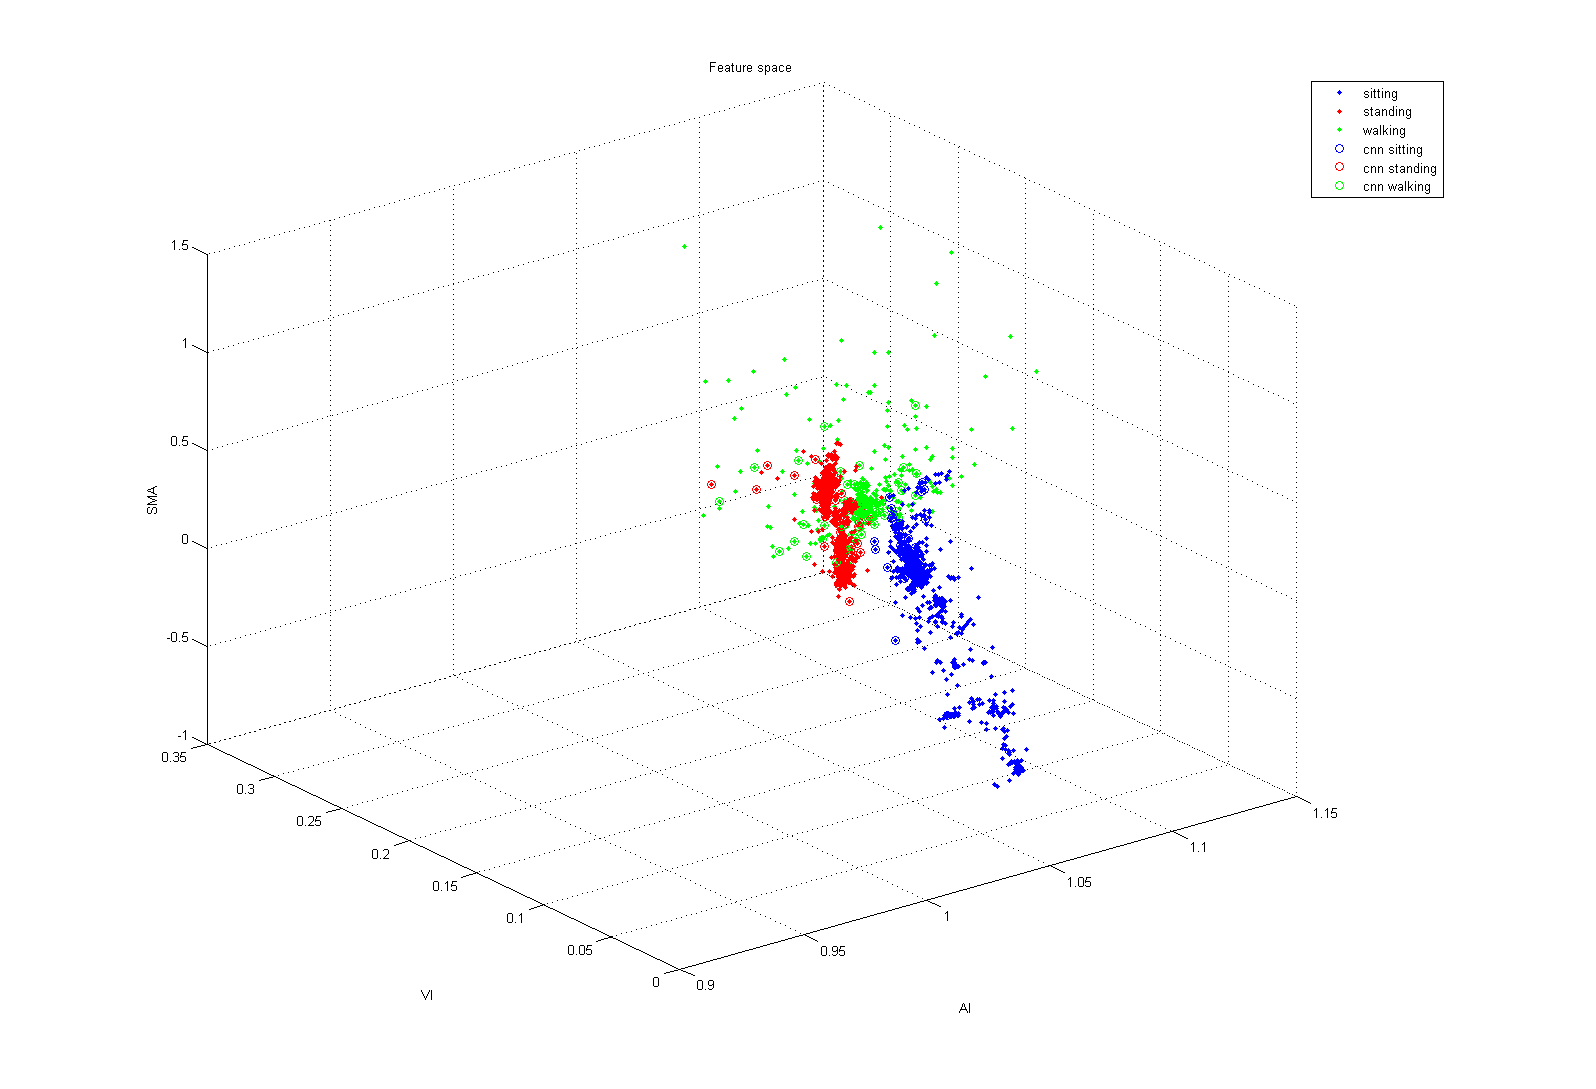
Edit:
I just found out I forgot to take absolute the values on the SMA calculation. However, the accuracy did not change. Below is the corrected diagram.