We collect some data on Tuesday by tying the accelerometer on the right hip rather than the right upper thigh. The following picture shows how we collect the system.
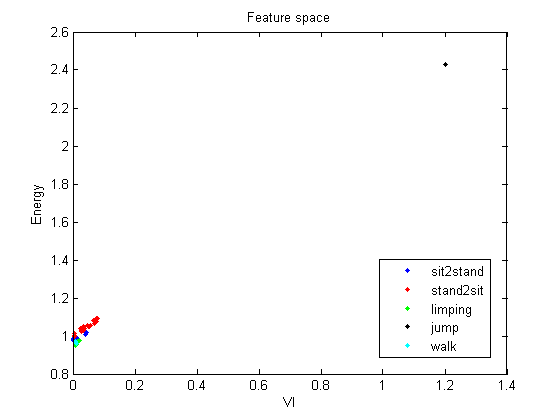
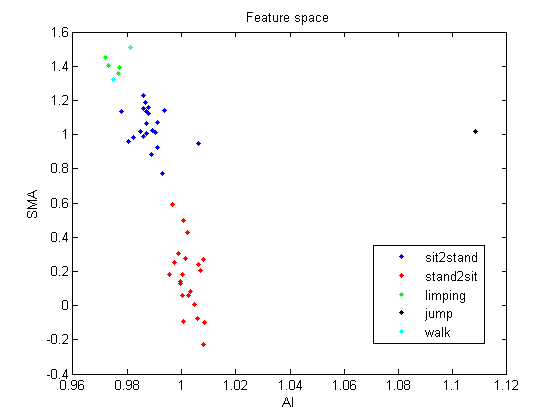
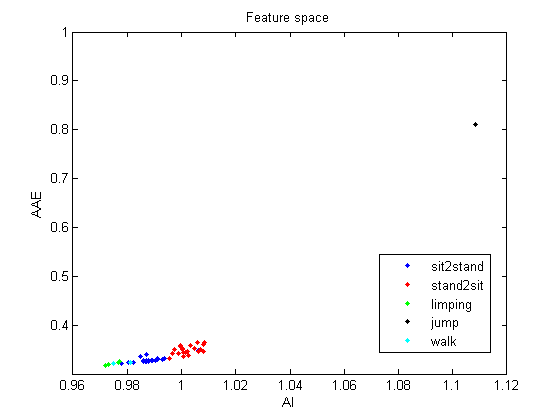
We collected the accelerometer data in a 5 second interval for the motion of sitting to standing, standing to sitting, walking, limping, jumping. Then we processed those time-series data to statistical and physical features. Average, variance, normalized signal magnitude area, dominant frequency, energy, averaged acceleration energy. Scatter plots in 2D feature space below shown that we could use some logistic regression to classify different activity.